PH Guided Force-Directed Graph Layout
Source Documentation Implementation
Idea and Implementation
This application is an implementation of the paper Implementation of Persistent Homology Guided Force-Directed Graph Layouts by Suh et al. Figure 1 shows the application.
Graphs, especially node-link diagrams are popular to show relationship between data. Graphs should represent clear structure as clutter and overlaps of unrelated structures leads to confusing visualisations. Suh et al. propose a new approach to layout force-directed graphs by utilising the persistent homology (PH) of a graph. A zero-dimensional barcode is computed of the connected metric spaces in which the PH features are embedded. Users can use the barcode to manipulate the force-directed layout interactively by changing the contraction and repulsion forces. The authors compare their proposed approach with other state-of-the-art force-directed layout approaches.
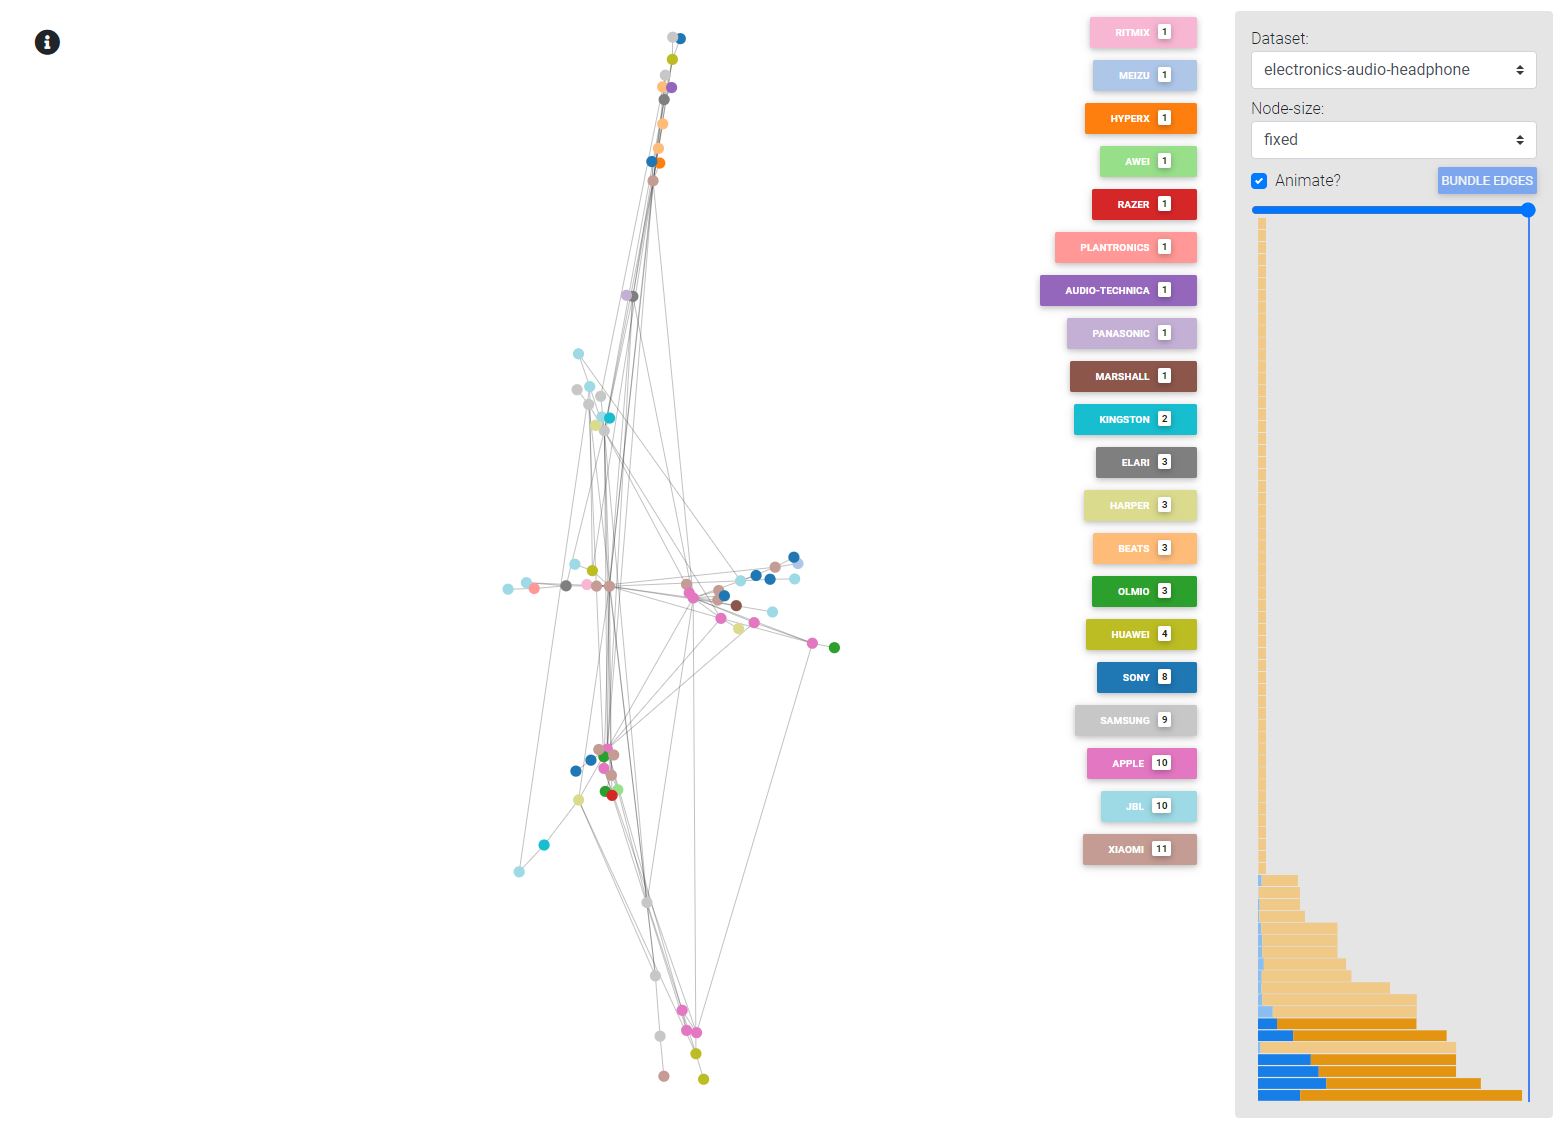
There are two main components, a force directed graph layout and a bar chart. The bars can be used to interact with the graph and change it. The bars are generated by using the persistent homology of the graph. Each bar is associated with an edge of the minimum spanning tree (MST).
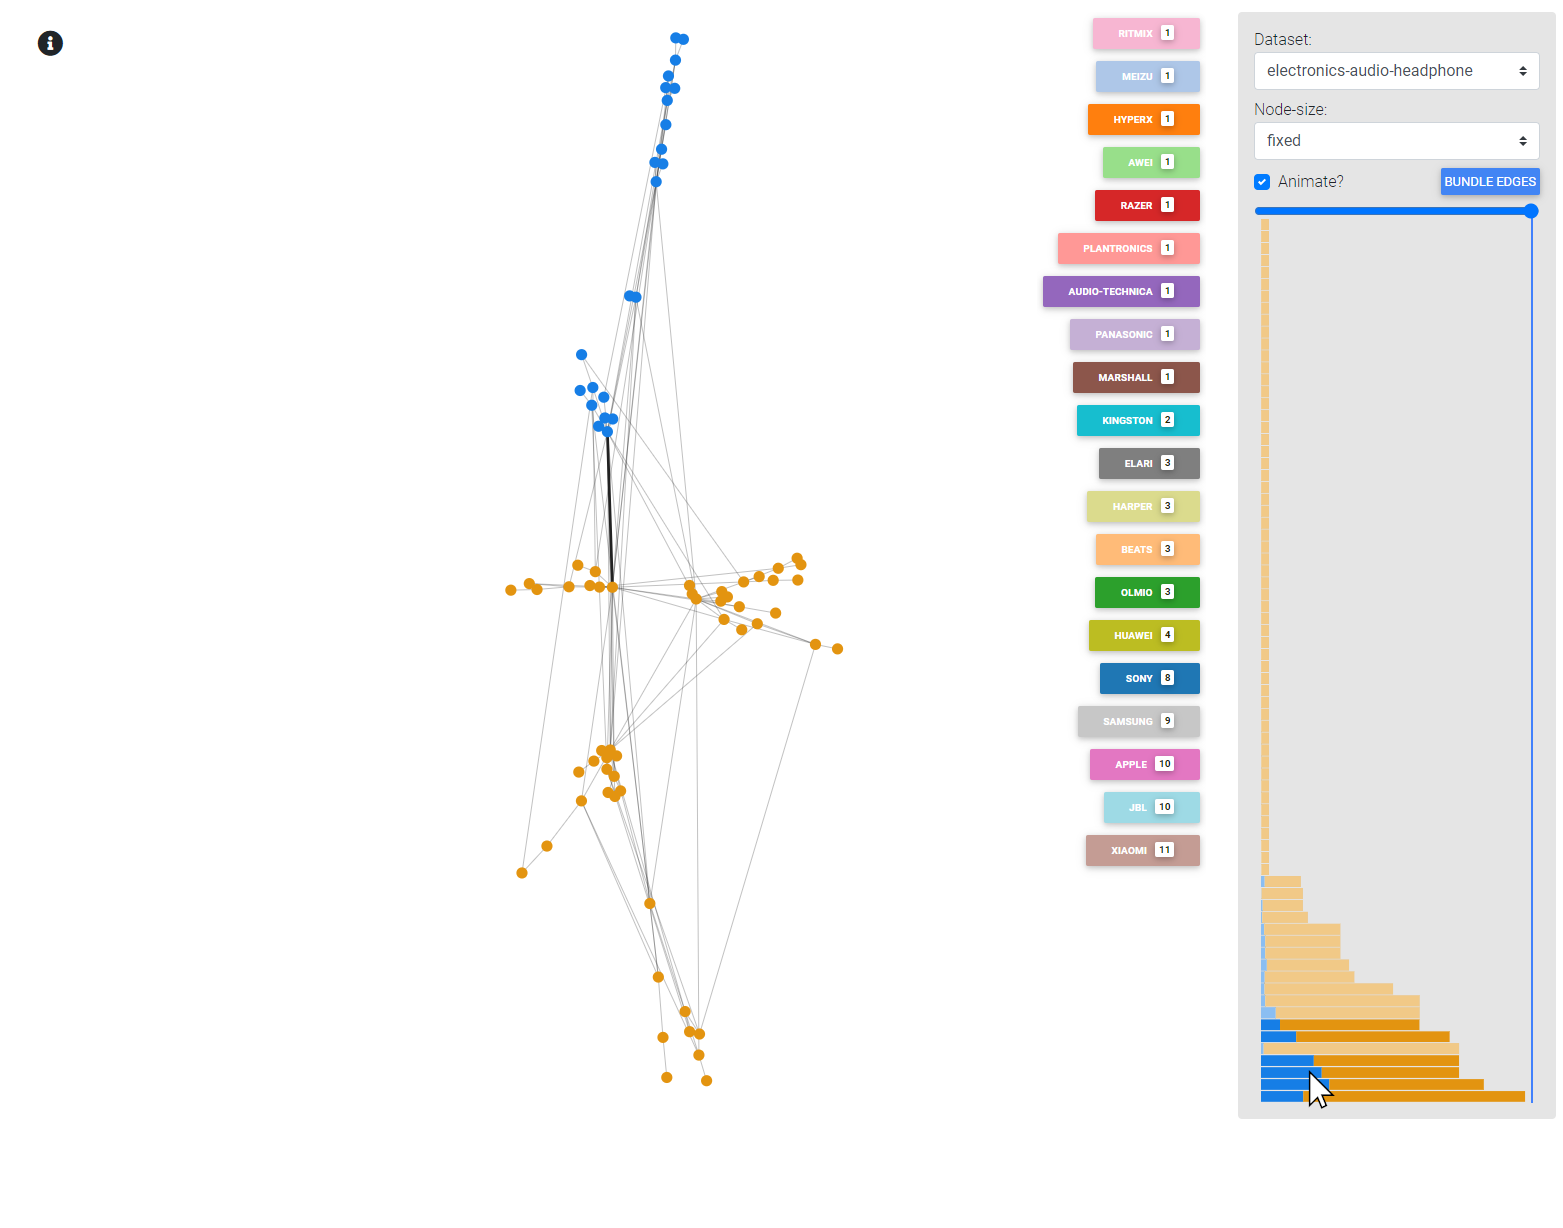
Figure 2 shows if a bar is hovered, the associated edge is highlighted. This edge separates the nodes in two subsets (regarding the MST). If the bar is selected repulsion is added between the two subsets of the nodes. Multiple bars can be selected as repulsion force is additive. Furthermore the slider, see Figure 2, can be used to add attraction to the edges associated to the bars. If the slider value is higher than the bar the associated edge will have a strong attraction force.
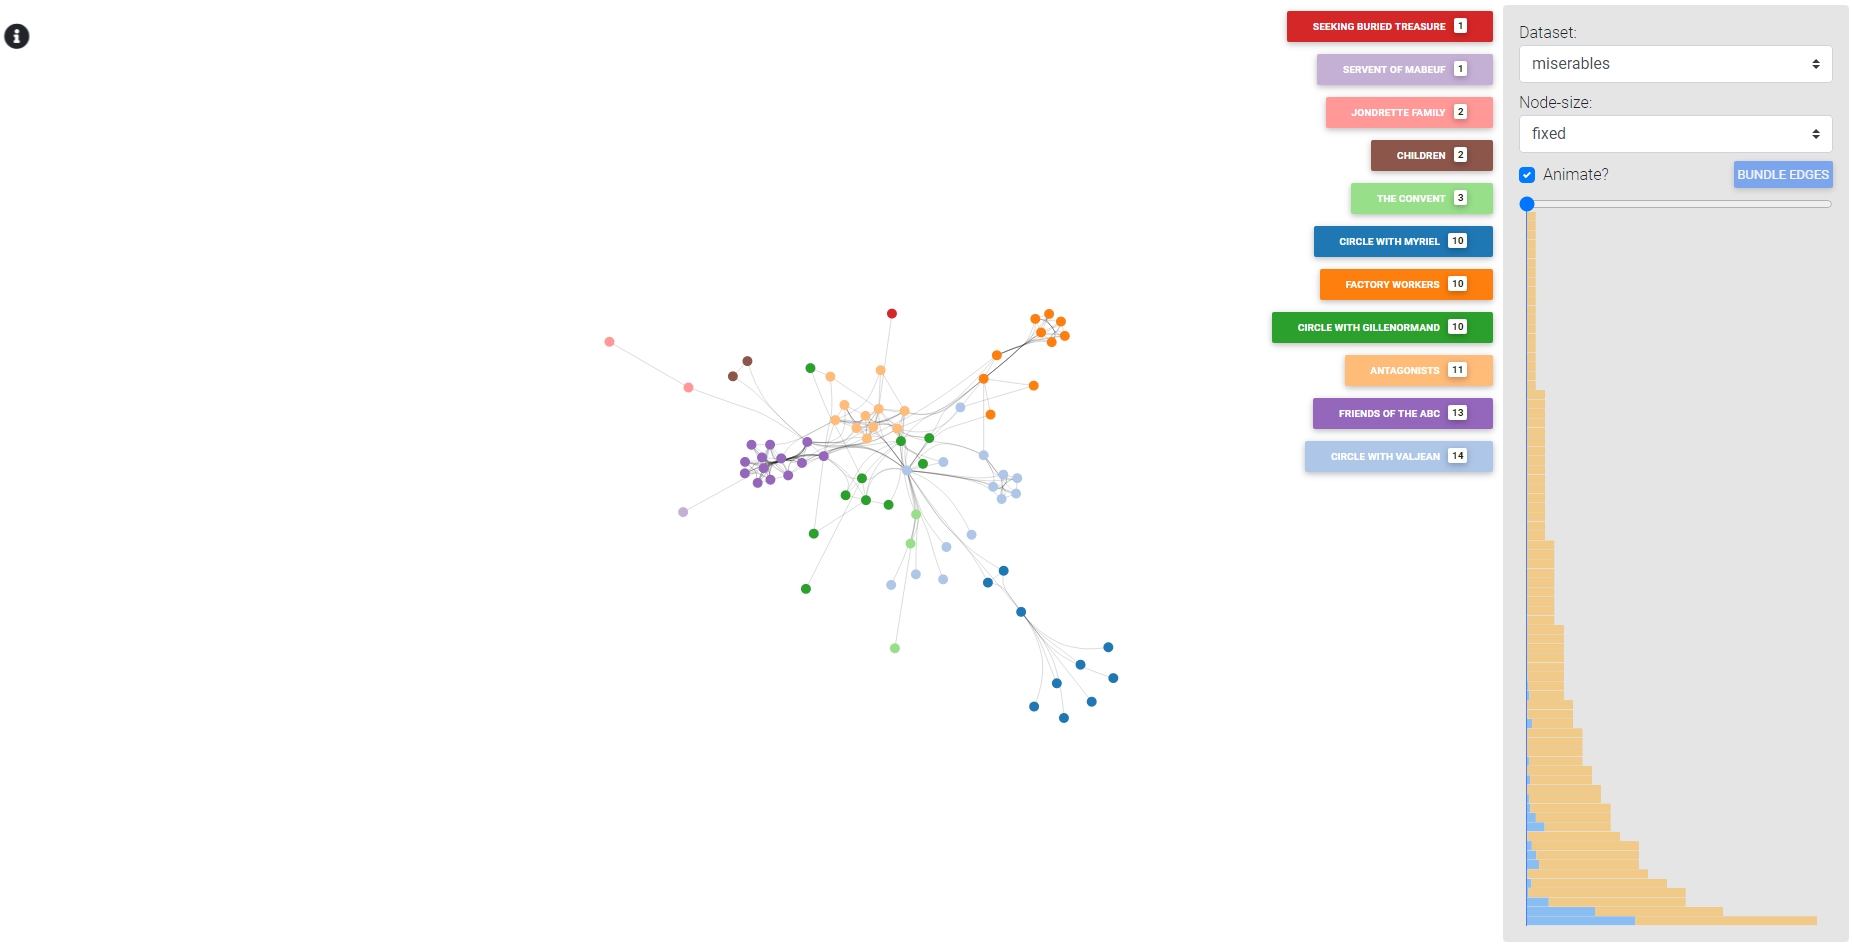
Further features clicking on nodes to get more information about the nodes as well as its neighbours. Using the "Bundle Edges" button, edge bundling can be enabled to make graphs less cluttered, as seen in Figure 3. Edge bundling is using an adapted version of the implementation of Corneliu S.d3.ForceBundle.
Technology
The implementation was realised using HTML5, Javascript and css. For the barchart and graph as well as the force simulation the D3 Framework is used. The page styling uses the following frameworks Boostrap, MDB, JQuery, Font Awesome and Google Fonts. The Force Directed Edge Bundling is an adaptation of the implementation d3.ForceBundle by Corneliu S.
Additionally we provide python scripts that can be used to generate json datasets that can be explored, see source code for more details. Inline documentation provides information on how the python scripts are used.
The documentation was created using JSDoc.
Dataset
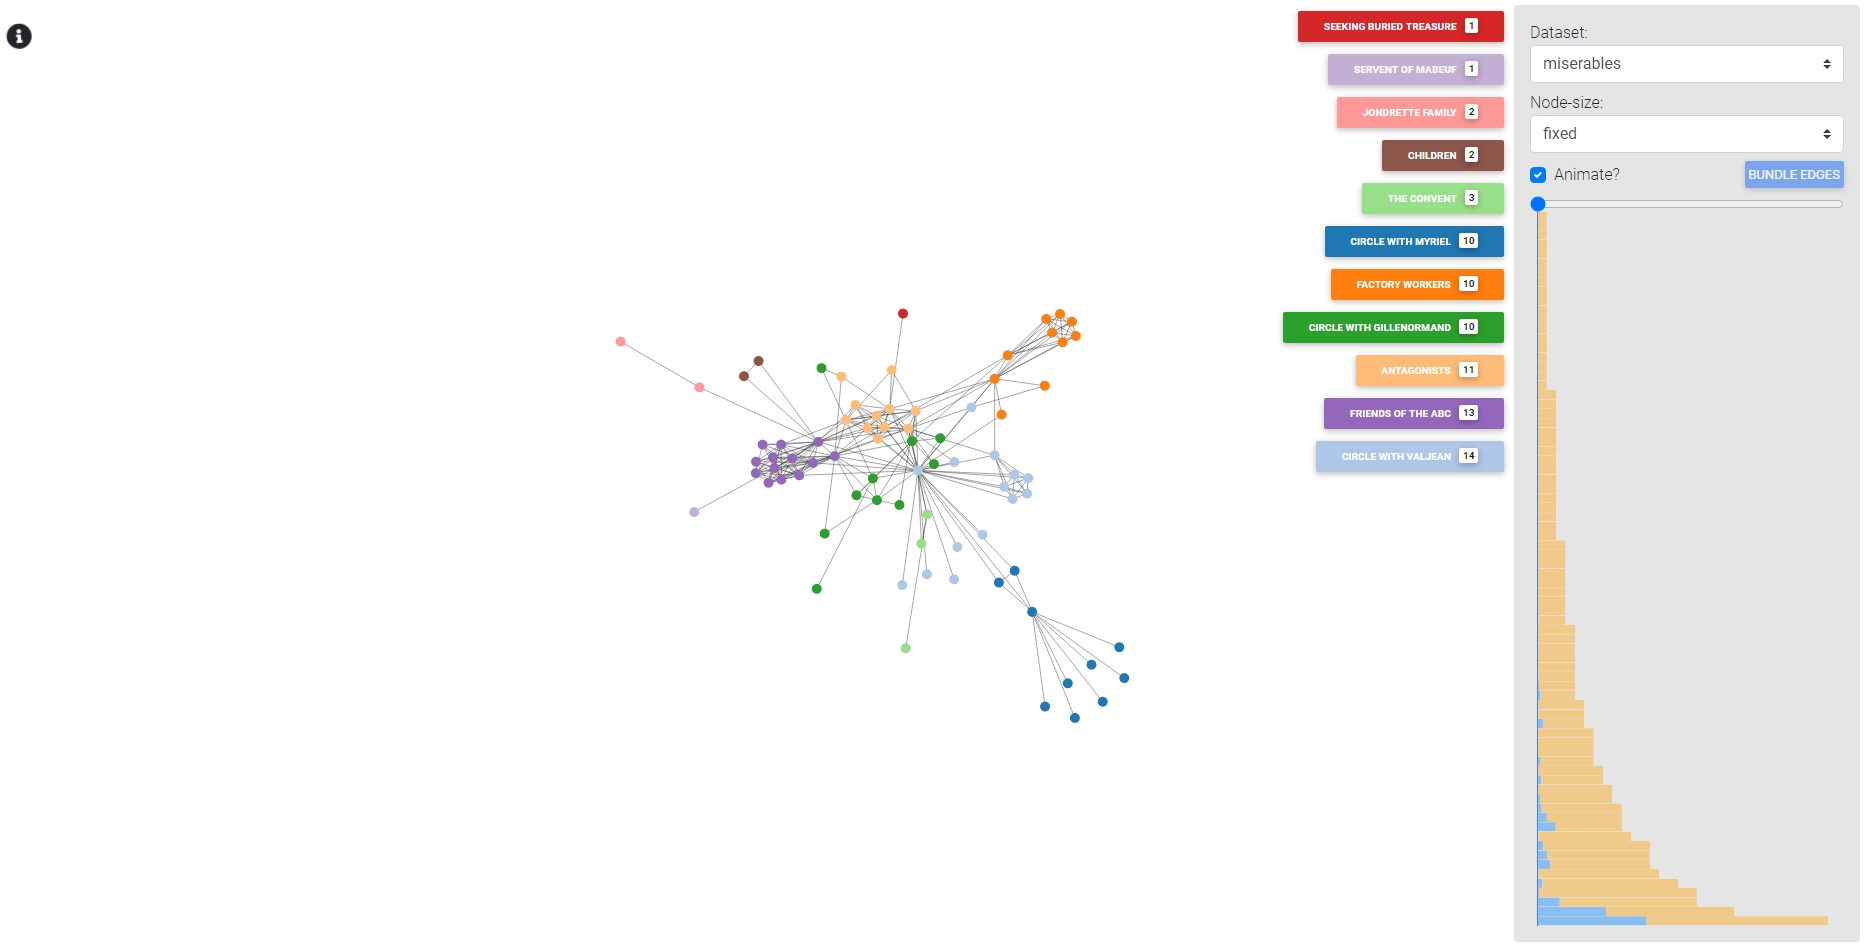
We visualise a subset of data from eCommerce behavior data from multi category store. We provide a few subsets that can be explored. We also included the "Les Miserables" dataset to compare our implementation with the results of the original presentation.